# Unsupervised learning
Unsupervised learning groups observations without being given labelled training examples.
Advantages
- The algorithm can pick up patterns that the original choice of labels might have obscured.
- Data does not need to be labelled, which can greatly expand the available sample.
Common applications include cluster analysis, association rules and dimensionality reduction.
# Cluster analysis
Cluster analysis groups objects according to how similar they are on selected attributes.
# K-means
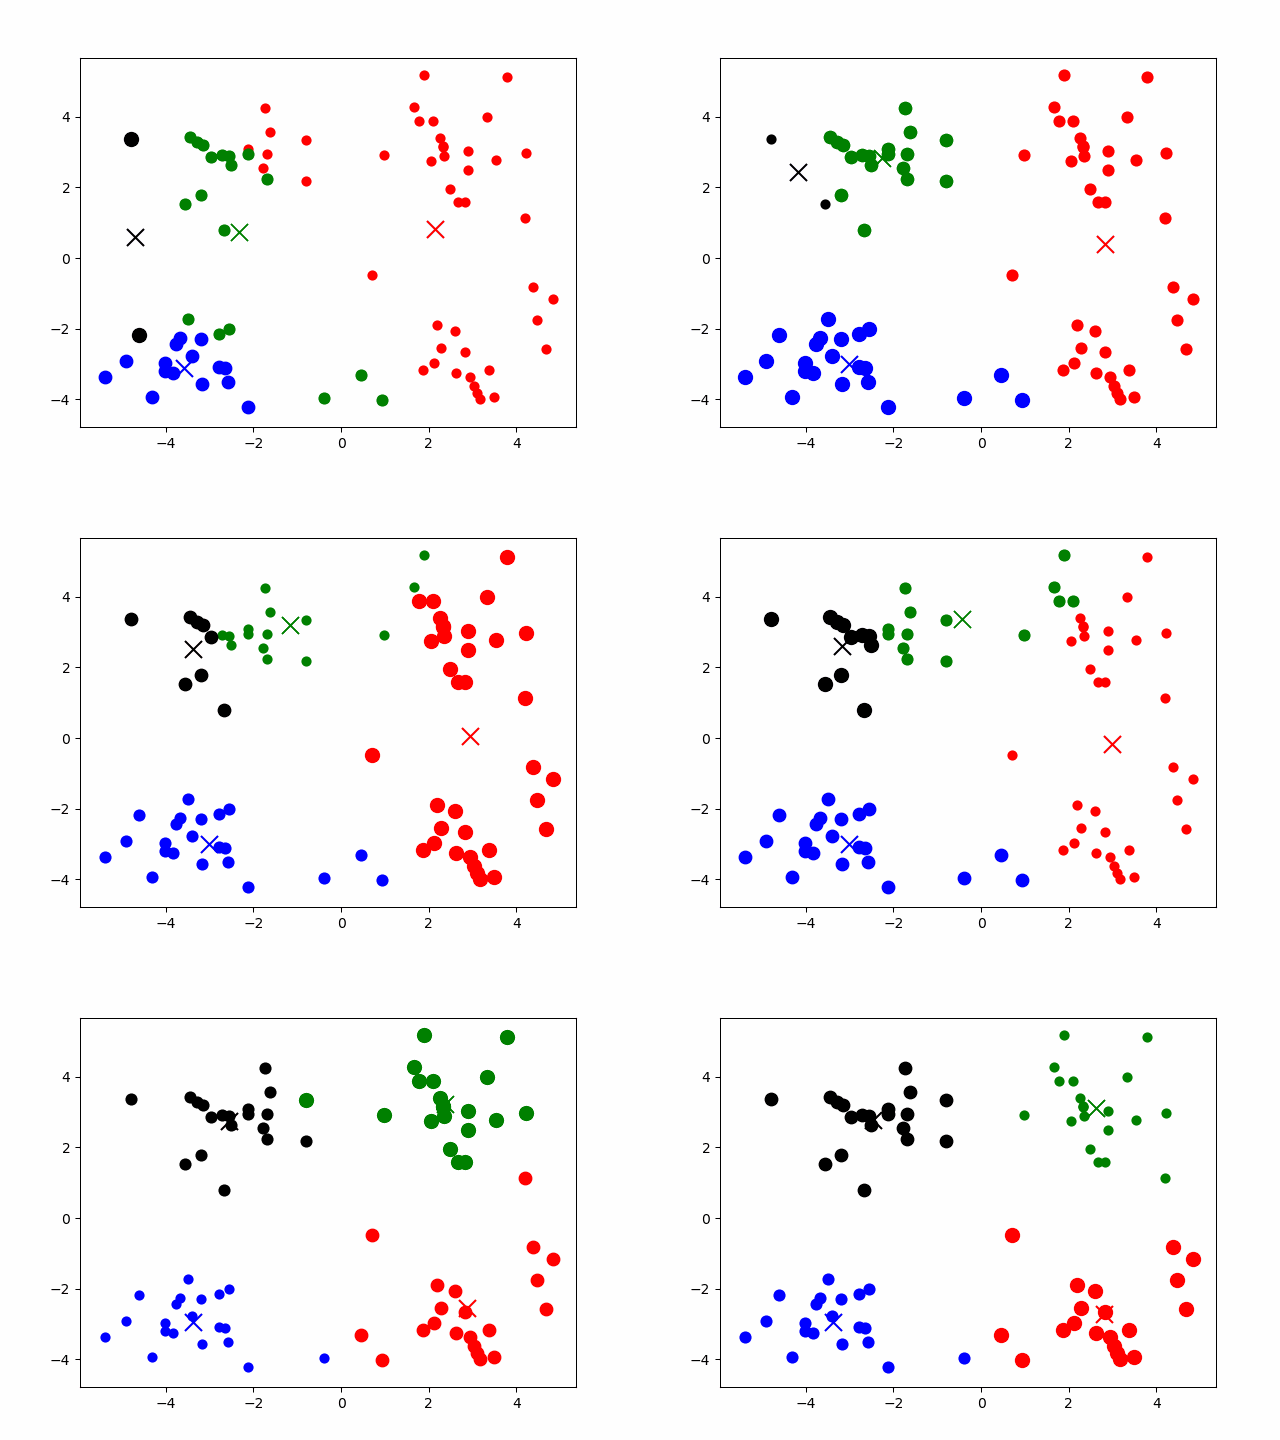
Each cluster has a centre. An observation belongs to the cluster whose centre is closest to it.
Start with observations and cluster centres . Initialise the centres by choosing observations at random.
- Compute the distance from each observation to each centre and assign it to the nearest one.
- Move each centre to the mean of the observations assigned to its cluster: , where counts the observations in cluster .
- Repeat until the assignments and centres settle.
K-means is simple to implement and often converges quickly. You have to specify the number of clusters, and different initial centres can produce different results.
# KNN
The k-nearest neighbours classifier uses supervised learning. For a new observation:
- Find its k nearest neighbours in the training set.
- Assign the class that occurs most often among those neighbours.
# Mean-shift
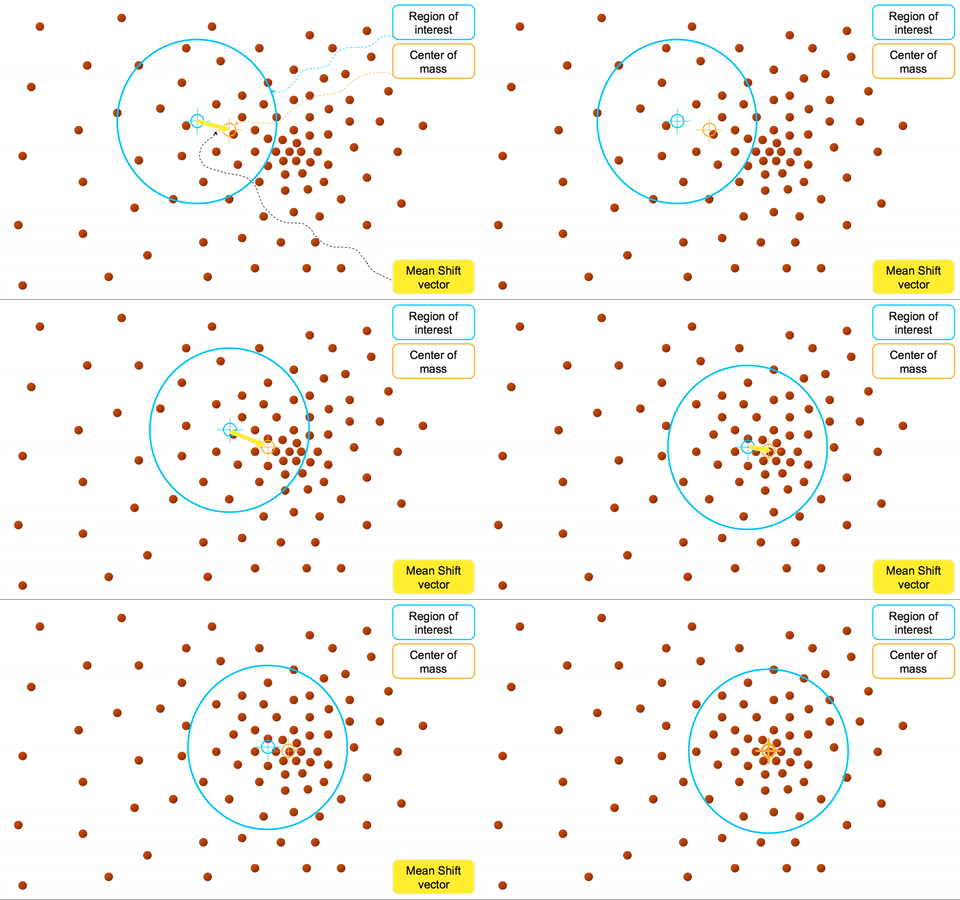
Mean-shift looks for cluster centres by moving towards regions of higher density.
Choose an observation at random as the starting centre . Let contain the observations within radius of that centre.
- For each point in the neighbourhood, take its displacement from the centre to the point. The mean displacement is .
- Add the displacement to the current centre: .
- Repeat until the centre settles.
You choose the neighbourhood radius (the bandwidth). There is no need to specify the number of clusters up front.
# DBSCAN
DBSCAN groups observations by local density.
- Identify points with a sufficiently dense neighbourhood.
- Expand each cluster outwards from its core points until no further points can be added.
DBSCAN can mark isolated observations as noise and does not require a predefined number of clusters. Results depend on how much the density varies across the dataset.